After more than 40 years of operation, DTVE is closing its doors and our website will no longer be updated daily. Thank you for all of your support.
When Good Streams Go Bad: Maintaining and Sustaining Video Quality
When it comes to video streaming, the issue of quality can be both relative and subjective which is why video service providers agree that establishing key performance indicators is critical, says Noreen Hafez Ayan, director of global product marketing at Akamai Technologies
 The notion of video quality means different things to different people, covering a subjective spectrum so broad that “good” to one person could actually be deemed “bad” by another. In an effort to formally identify what key factors affect video quality, Akamai recently commissioned a survey of more than 350 managers at direct-to-consumer (DTC) video service providers, also known as over-the-top video service providers (OVSPs).
Amongst the people surveyed, almost half had already launched a service. Another 21% planned to launch one within the next six months, and almost a third within the next year. Additionally, 22% had no fixed date set, or they were uncertain when the service would launch. This suggests the brisk pace we have seen for the launch of DTC or over-the-top video services is liable to continue late into 2017 and beyond.
If anyone had any reservations about how seriously these professionals take quality, respondents overwhelmingly indicated that they consider it the most important factor affecting their service.
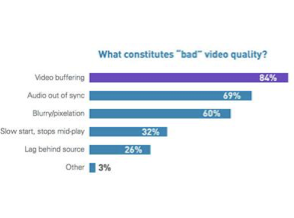 But what exactly makes for good or bad streaming video quality? Part of the survey asked that respondents list the top three factors they feel most affect video quality. We ranked the responses below to create a top five list of the most prominent offenders.
1 Rebuffering. Frequent and/or long video interruptions are the most reliable way to lose an audience, according to the strong majority (84 percent) of respondents. This can be the percentage of overall video streams affected by a rebuffering instance, or how many times on average a video play was interrupted.
 2 Audio sync. Coming in second, at 69 percent, audio that is either noticeably ahead or behind video causes major annoyances. In fact, studies have shown that audio problems can be more intrusive to viewers than video problems.
3 Pixelation/blurring. Rounding out the consensus top three issues affecting quality (60 percent) is video pixelation or blurring during playback, which is commonly associated with delivering improper bit rates.
4 Load time. Interestingly, a significant drop-off takes place after the top three factors affecting video quality. Load, or start-up time, was listed in the top three by only 32 percent of survey respondents.
5 Latency. Often highlighted within the context of live sports is the lag time between content airing on TV/cable (or reactions on social media) compared to streaming. Not necessarily correlating with the level of viewer complaints seen in the media, latency made the top three by only 26 percent of those who took the survey. This is primarily due to the fact that latency concerns are largely limited to live streaming, not on-demand viewing.
Amongst the many challenges that video streaming businesses face, including video workflow and offloading network traffic, the provision of better quality video is by far the most important. The survey participants seemed acutely aware of the impact of rebuffering and slow video starts. They also recognise that quality issues pose the biggest threat to attracting and retaining subscribers and viewers of their service.
So, given their concerns, what does happen when viewers encounter a low-quality experience? For a start, engagement drops. A separate study, using Akamai data helped to demonstrate that viewers begin abandoning a video if it takes more than two seconds to start playing. For every additional second, 6% more of the audience leaves. By 10 seconds, nearly half of the viewers have left.
Not only do viewers leave, but chances are they might not return. The same study showed that viewers who experienced failures were less likely to revisit the site compared to those who did not encounter a problem with the video. This can adversely affect viewership as well as potentially damage the brand.
Given the clear emphasis on quality, it is not surprising to note that 44% of the OVSPs in this survey have established key performance indicators (KPIs) against which they can judge and manage their service performance. The remainder will need to do this, or alternatively, better communicate KPIs to the people in their organisations with responsibility for the service.
As to monitoring performance against the KPIs, the service providers take various approaches. Almost a quarter (23%) are comfortable allowing their content distribution network (CDN) partner to tell them how they are doing. Thirty-one percent (31%) either charge their ops team or a third-party provider with that responsibility. Twenty-eight percent (28%) recognise it as the responsibility of both the ops team and CDN working together.
We have established that, while quality can be relative and subjective, a poor delivery experience can negate all the investment in content and marketing that a video service provider must make to launch its service. It can also be very difficult to recover from. So, establishing key performance indicators is critical—not just to the business, but for the consumers and advertisers who are helping to pay the bills.