Ericsson: consumers see more value in VOD than linear, mobile viewing exploding
 Consumers are turning to on-demand services in unprecedented numbers, are spending longer searching for content on VOD sites than on linear TV and are viewing more user-generated content as a proportion of their total video viewing time, according to the latest findings of Ericsson’s Consumerlab research project.
Mobile video viewing is also growing dramatically, with time spent viewing content on mobile devices up 85% in six years, as previously reported by Digital TV Europe. Mobile viewing time has increased by four hours a week while fixed screen viewing has declined by 2.5 hours a week since 2012. In the US, 20% of increased mobile viewing is for paid-for premium content.
The survey found that 40% of consumers globally are interested in mobile data plans that include all-you-can-eat video time, rising to 46% among millennials.
The latest Consumerlab survey found, among other things, that consumers in the US spend 45% more time choosing what to watch on video on demand (VOD) services than scheduled linear TV services.
VOD satisfaction
The survey found that 63% of consumers are very satisfied with content discovery in their VOD service, while only 51% say the same for their scheduled linear TV provider
Consumer spending on VOD services in the US has increased by over 60% in just a few years, according to Ericsson.
 Over a period of the last four years, consumers say they have increased their VOD spending from an average of US$13 (€12) to US$20 per month. While paid-for scheduled linear TV services continue to account for about half of the average household media spending in the US, and the average household uses 1.3 scheduled linear TV services, it also uses 3.8 VOD services, the survey found.
Report author Anders Erlandsson said that, while there are significant differences between the US and other markets in terms of the absolute numbers using VOD and the time they spend on it, the overarching trends are common across markets. “The levels are different internationally, but we are seeing similar growth patterns. The angle of the curve is similar,” said Erlandsson.
In general, people have a more positive opinion of VOD services than of linear TV, even though they spend more time looking for content on the former than on the latter.
“On demand services are outperforming linear TV in net promoter scores. That applies across all markets,” said Erlandsson. “They spend more time searching for content. That is interesting because. They have higher expectation of finding exactly what they are looking for [on VOD services].”
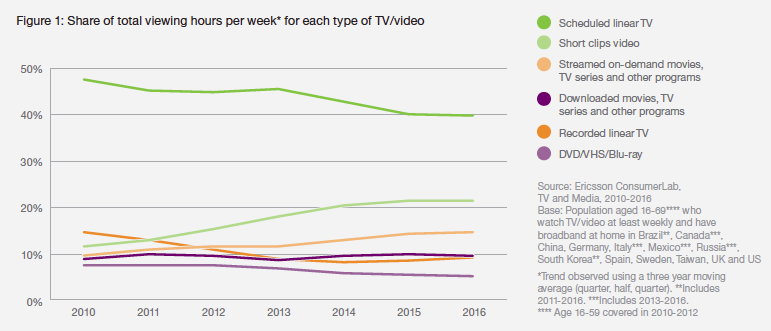
The portion of total viewing hours for scheduled linear TV content has decreased slightly by 16% since Ericsson’s 2010 survey. At the same time, on-demand viewing – such as streamed TV series, movies and other TV programmes – and short video clips have grabbed a growing portion of the total viewing time, increasing by 50% and 86% respectively. In total, all types of on-demand viewing now make up 43% of all active viewing, out of which movies, TV series and other TV programmes account for 74%.
Millennial habits
Among millennials, video consumption time is increasing significantly compared with older demographics, with a substantial portion of the increase attributable to viewing of YouTube-type content, with viewing on mobile devices growing in line with this.
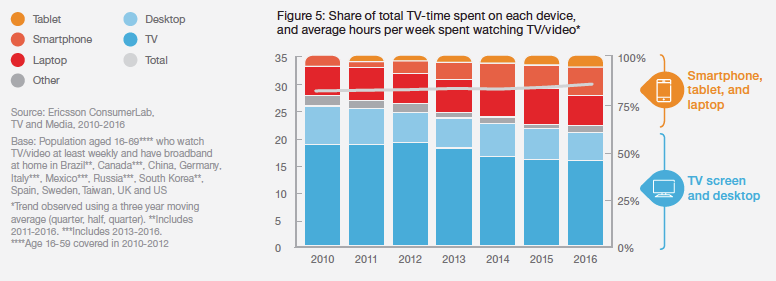 “Globally, there is growth of four hours a week of viewing on mobile screens and a decline of two and a half hours spent on the big screen,” said Erlandsson, adding that the decline in fixed screen viewing was not universal. “In the UK there is a small increase in big screen viewing of about half an hour,” he said, with the overall increase in consumption outperforming other markets.
The robustness of fixed screen viewing in a market like the UK is likely be attributed to the availability of extensive catch-up and on-demand services and the high rate of penetration of connected TVs.
‘That might be an opportunity to limit the decline of fixed screen viewing going forwards,” said Erlandsson.
In general, while the survey highlighted the growing importance of mobile consumption – as reported by DTVE following Ericsson’s pre-briefing on the report at MIPCOM in Cannes last month – there is also growth in consumption of on-demand services on connected TVs.
On the mobile front, Erlandsson said there was a trend towards more viewing of long-form content, especially on devices with bigger screens.
“Historically mobile consumption was only about short-form content, but we are seeing more long form content on tablets and laptops. It is screen size that is a major barrier for long form content. It is also an age thing. Younger viewers can feel the smartphone is big enough for a TV series while commuting,” he said.
The extra viewing time recorded by younger consumers is directly related to time spent viewing online video.
“Lots of the extra viewing time in the younger age group comes from user-generated content. That is the number one type of content that millennials spend the most time on – the biggest chunk of the 34 hours a week that they are spending on video. It could be short or long-form content, and they watch a lot of downloaded content as well,” he said.
“UGC is increasingly appealing to many, and younger consumers in particular. Today 16-34 year-olds spend almost 2.5 hours more each week watching streamed on-demand user-generated content than 35-69 year olds. At the same time, 16-34 year-olds spend almost four hours less than 35-69 year-olds when it comes to watching live linear broadcast content.”
An increasing proportion of online viewing is accounted for not only by user-generated content but by genres such as eSports.
“Growth is happening both for longer-form content and TV series but there is even greater growth in short video clips on YouTube, Twitch and other eSports services. With eSports, viewing is often live rather than on-demand. Consumers don’t want one thing only,” said Erlandsson.“Across the board, eSports is not every significant. Online accounts for an average viewing time of 30 hours a week with eSports taking an hour. But for millennials it jumps up quite a bit and that is even more the case for under 24s. Millennials are spending 5% of their time on eSports.”
Binge evolution
The Consumerlab report also recorded more so-called ‘binge viewing’ – viewing of multiple episodes of TV series – which can be attributed to the evolution of the user experience on both SVOD and free-to-view catch-up services to encourage this type of behaviour by teeing up the next episode immediately – so that viewers have to actively switch off the next episode of the show they have just watched. It is also growing because free catch-up-type on-demand services increasingly have full series available on-demand rather than just the episode aired that week.
“Binge viewing is not just something for millennials but is done by older viewers too,” said Erlandsson. “Face-to-face interviews reveal that it is easy, because services promote ongoing viewing. One of the challenges historically with catch-up services was that they haven’t offered more than a couple of episodes. That is a serious limitation. Making more content available encourages binging.”
The Consumerlab report also looked at the way in which different groups can be defined by behavioural characteristics and the way in which those characteristics are changing over time – and how this will have an impact on existing business models.
Ericsson had previously identified six different groups for the purposes of its analysis: TV couch traditionalists, screen shifters – who flit between screens, computer centric – who most stream video to their PCs, mobility centric – who use mobile screens first, average TV Joes – who spend a bit of time on online video and watch an average amount of TV, and TV Zero – those who watch little.
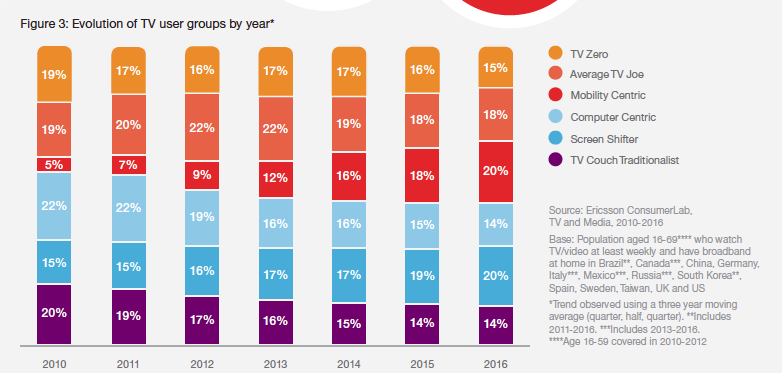 “We looked at six different TV user groups and how they have evolved. Couch traditionalists are a declining group, and they are the 0high spenders when it comes to broadcast TV,” said Erlandsson. “The screen shifters and mobility-centrics on the other hand are growing at a staggering pace.”
Since 2010, the TV Couch Traditionalists group has shrunk by more than 30% while Screen Shifters has grown by 33% over the same time period. Mobility Centrics has increased by more than 300%, making this the largest group alongside Screen Shifters.
TV Couch Traditionalists spend 35 hours per week watching any type of TV and video content, but Screen Shifters spend significantly more – 62 hours per week, partly because this group tends to view content on multiple screens in parallel.
Could these shifts potentially have a deleterious impact on traditional pay TV service models? “People [in the US traditionally] spend US$85 a month on pay TV and spend less than US$10 on VOD. Screen shifters on the other hand spend US$10 less on pay TV but US$50 more on VOD. They are big spenders but they are spending on VOD, and SVOD is a significantly bigger portion than TVOD,” said Erlandsson.
He says that the challenges this poses for traditional pay TV providers crosses territories and is not specifically related to the largely US phenomenon of cord-cutting driven by the high price of pay TV, however. Pay TV providers therefore have an opportunity to adjust to the trend by evolving their offerings to meet the growing demand for non-linear viewing.
“Cord-cutting because pay TV is overpriced is not really the reason why people are cutting down on linear and viewing VOD. We are seeing similar patterns in other markets,” says Erlandsson.